

[HOME]
[WEB ALBUMS]
[PROJECTS]
[ARCHIVE]
[DOWNLOADS]
[LINKS]
PROJECTS
Project MK27-Orion-KL maser at 22G Hz
The nebula was dicovered in 1967 by Douglas Kleinmann and Frank J. Low.
here wiki
From that time upto now, a huge amout of data is obtained.
It is a region where solar systems are in the making; we see one of them, looking at the rotating disk almost edge-on.
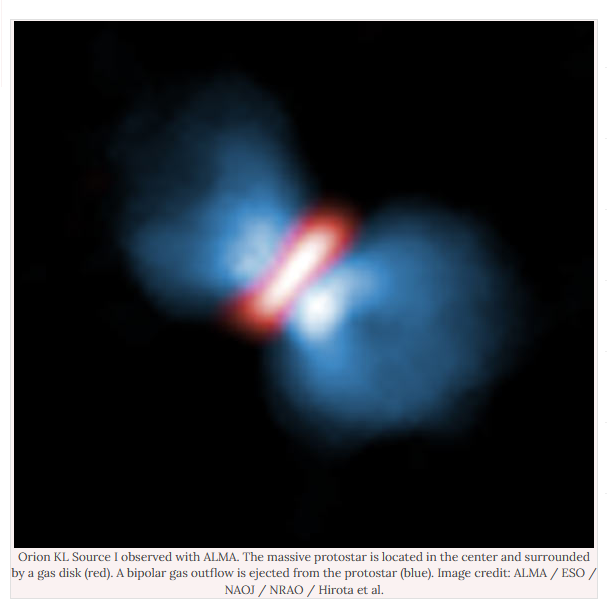
Orion-KL-Source-observed-with-ALMA
Also artists impressions give an idea.
here Orion-KL
and here Orion-KL
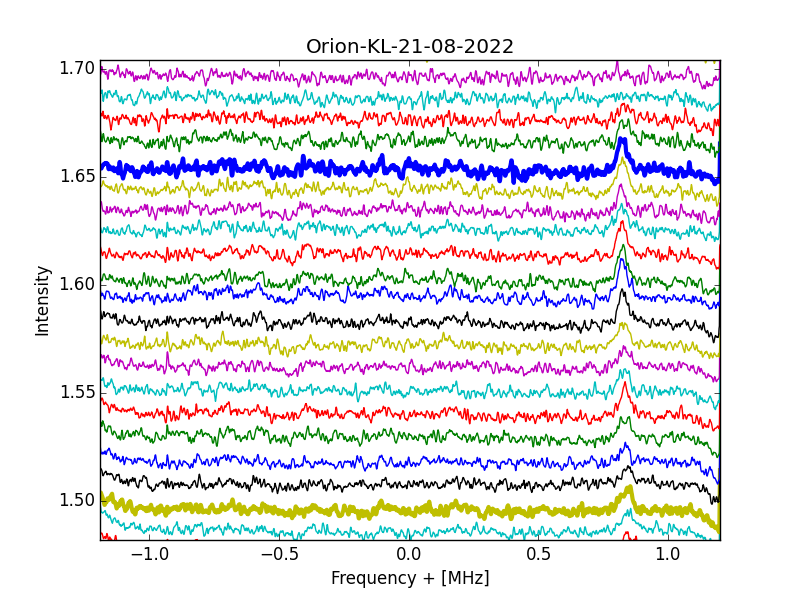
So, what do we see with our 1 pixel radio telescope, well...this
Orion-kl-21-08-2022-w10-overview
Every line is the result of 5minutes integration
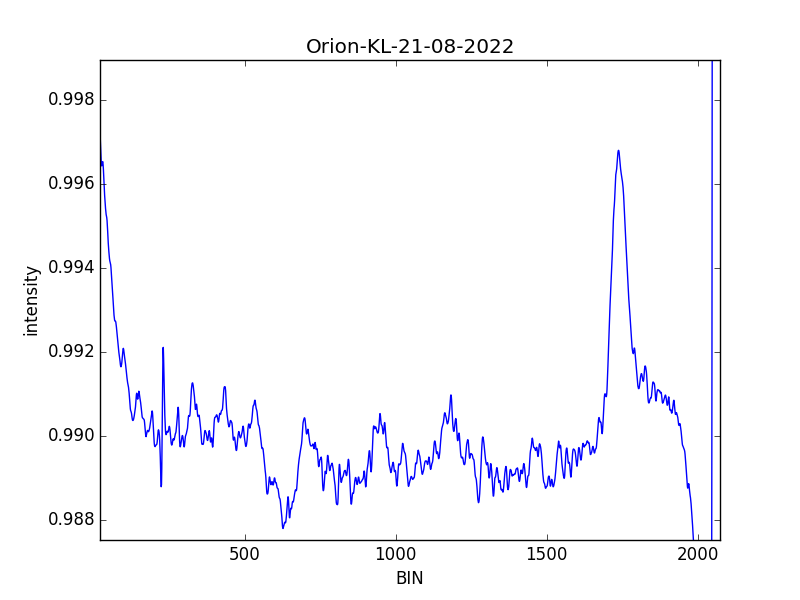
The sum of 40 lines gives this
Orion-kl-21-08-2022-w10-sum5-45
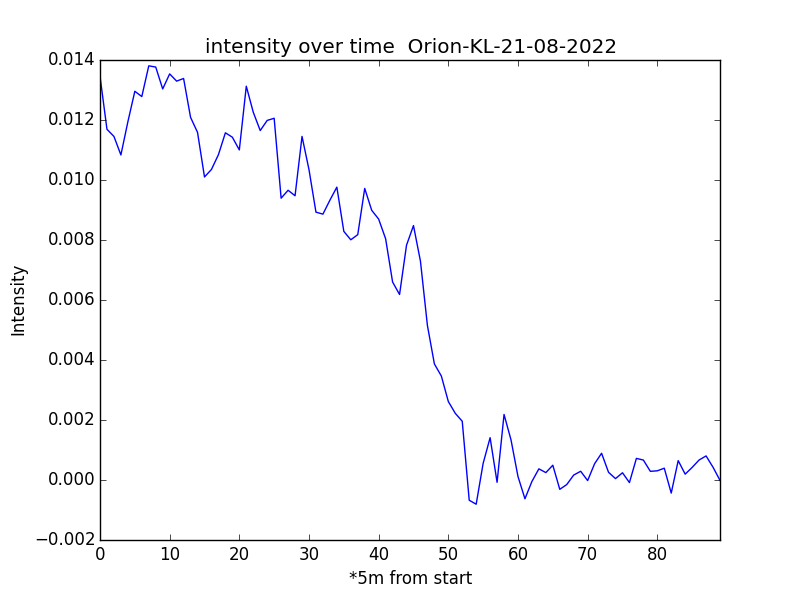
Often a graph of the signal intensity over the measured time looks like this
Orion-KL-intensity-over-time-45
Because of the high drift effect of the Dielectric Resonant Oscillator during 40*5 minutes, all the result lines have to aligned again. Assuming a lineair drift in time, this can corrected easy.
To improve the signal to noise ratio further we repeated the measurements on other days and with a different receiver. This is done to be sure that the profile of the received signal is the same.
However the problem is now to get the x-axis and y-axis aligned.
One way to do that is "by eye". Another method is using the correlation function in Python. Here one graph is shifted from -50 to +50 bins compared to the other, while noting the correlation value after every shift.
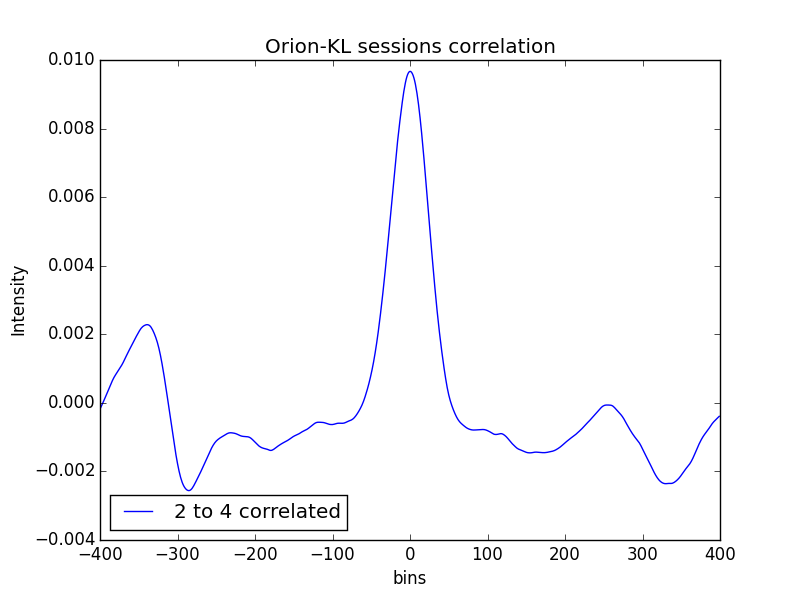
Orion-KL-x-axis-correlating-2-graphs
Next the amplitude must be made thesame. Now we keep one graph as reference and we change the amplification of the other graph. Next we substract them and we note the sum of all the bins. When the graphs are equal, then the difference should be zero; or the lowest value gives the best amplification factor.
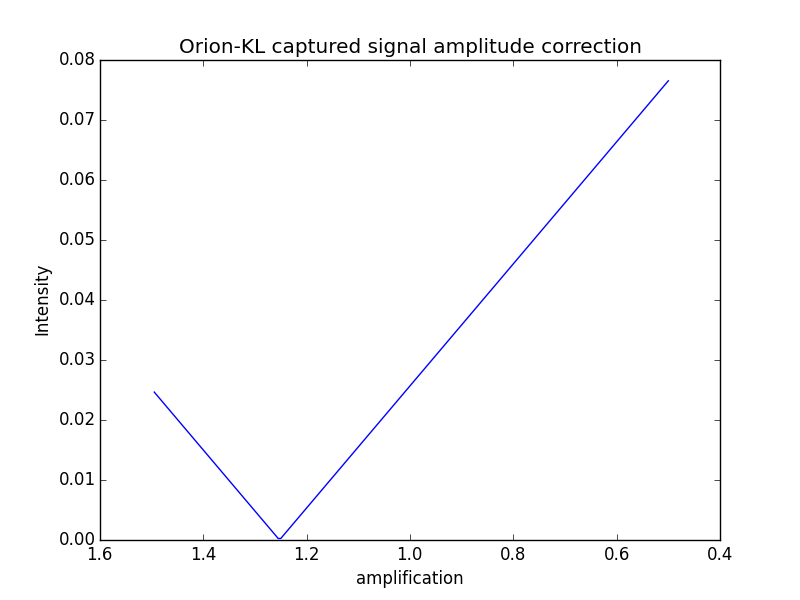
Orion-KL-2-graphs-normalizing amplification
Now we can add all the collected measurements together.
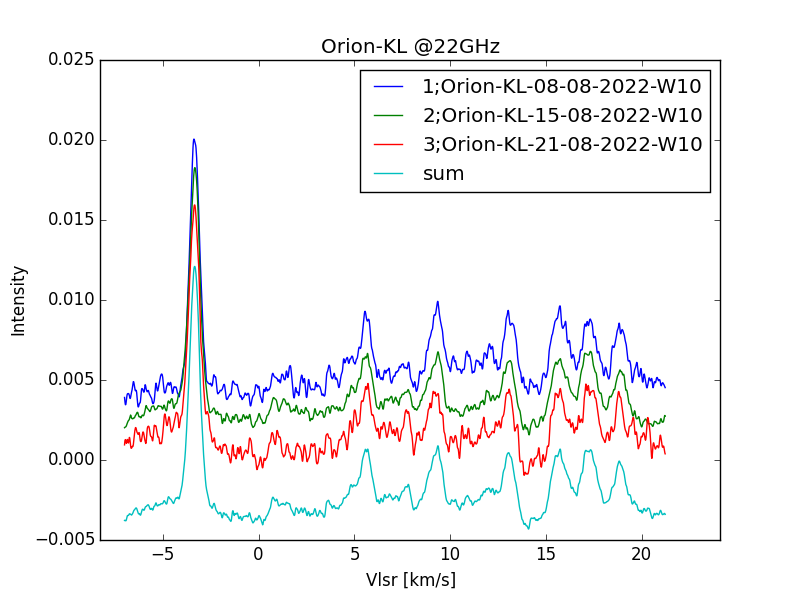
Orion-KL-sum-of-3-days
The end result shows one large peak and at least 6 minor peaks almost evenly distributed over the velocity axis.
With our single dish telescope we cannot see the spacial distribution, but we can 'see' the velocity distribution.
These peaks are all moving at different velocities because they are moving in rings around the protostar.
Every time a jupiter like cloud is overlapping another along our line of sight the maser signal is amplified extra.
This lasts until the cloud clump passes the other. So instead of obscuring, the radio signal is amplified. This can only work when we , in this case, are looking at that proto solar system edge-on.
In literature we found bursts period times of 4, 13, 30, and 170 years. This is comparabel to the periods of the planets in our solar system.
Perhaps the peak on -3.7km/s is also from an alignment of gas clumps or a warped ridge.
pdf :Structure of the Source I Disk in Orion-KL.
When first this huge increase was noticed astronomers called it -imaginative pumping-.
Later it was noted that because the maser spot is very small, the huge increase in intensity in some events was likely caused by beaming and not by pumping.
The smaller individual peaks also can further be examened. see below
We could determine the width of the peak or the FWHM (Full Width Half Maximum). The original mechanism of the maser just generates hyper fine line on 22 235 077.66 Hz. But from the receiver backend we get a broadened peak; the so called doppler broadening.
This is caused by the moving molecules. The movement or the temperature can now be determined by just measuring the width of the peak.
https://en.wikipedia.org/wiki/Doppler_broadening
However the peak is not standing alone; it is overlapped by other peaks. We can dis-entangle these gaussian peaks with curve fitting.
We just took the minor peak between 8 and 10km/s. It seems that 8 gaussians can fit the curve.
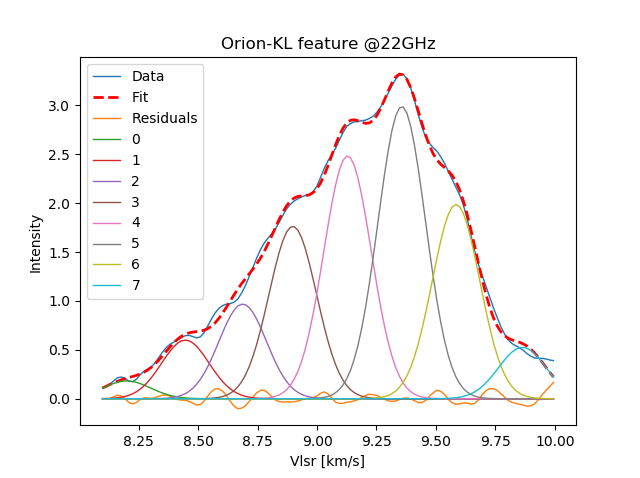
orion-kl-8-gauss-8-10-kmps-feature
The FWHM width of the number 5 gaussian was 17.5kHz. With the equation from the wiki page the resulting temperature is 22K.
This result is lower then expected, because it should be >60K. However, in the below paper another method of temperature calculation is used.
pdf :The H2O maser flare region in the Orion-KL nebula.
However the waterline is not one line, but it consisted of multiple lines.
The most prominent are 3 lines with frequencies 22 235 120 338 Hz, 22 235 077 660 Hz and 22 235 044 000 Hz.
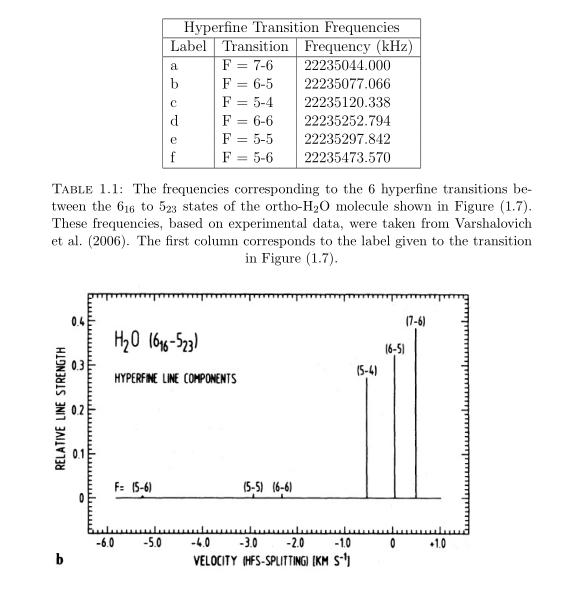
water-maser-triplets
A range of profiles with increasing temperatures can be plotted.
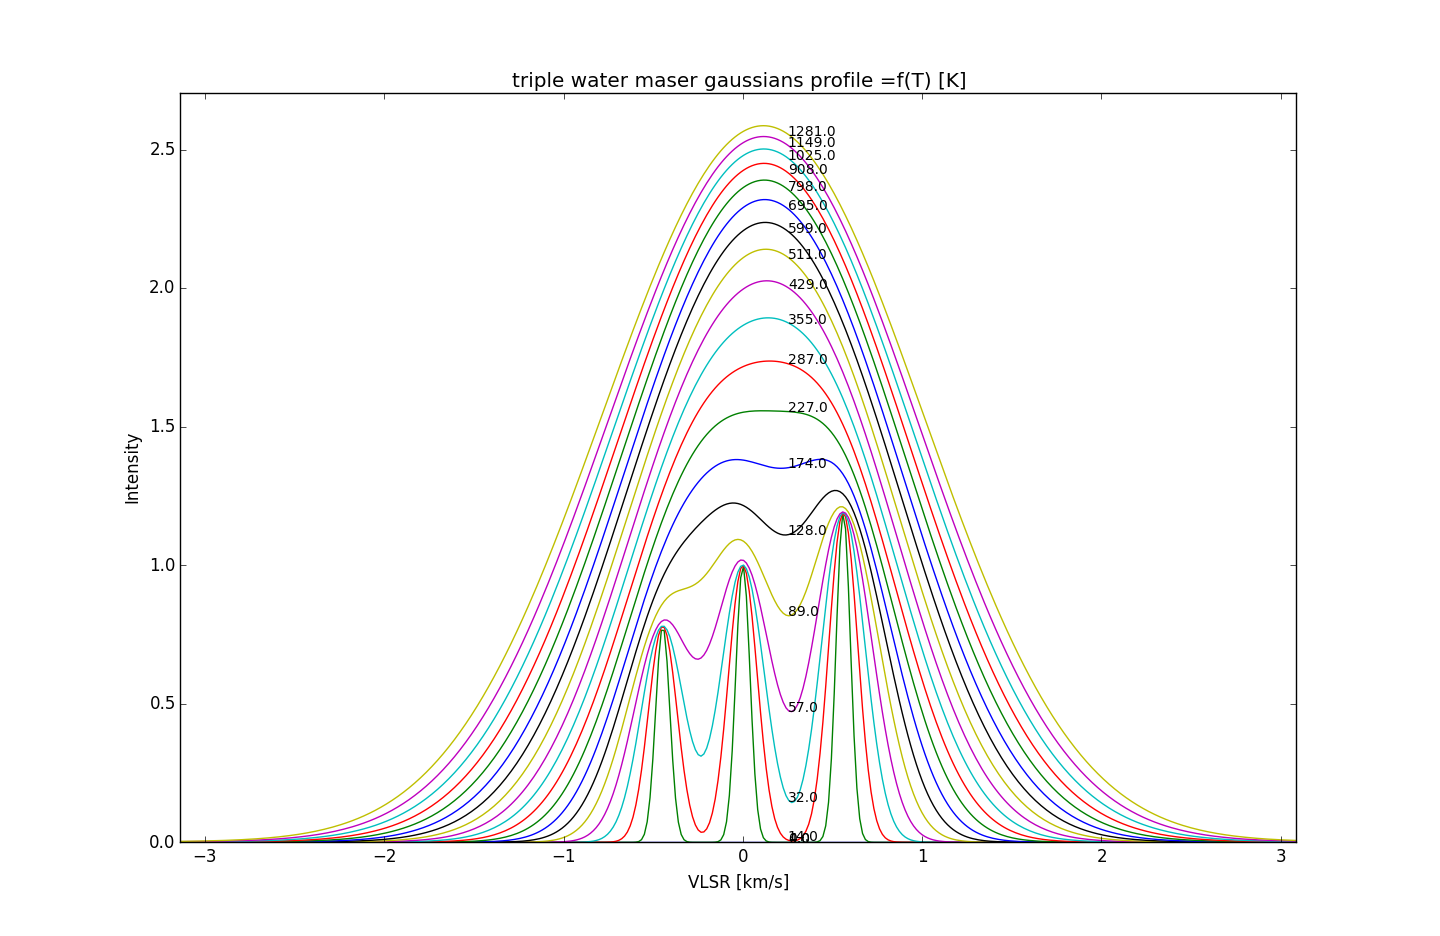
water-maser-triplets with increasing temperatures
Next we tried several times to fit a single, dual and a triple gaussian line onto range.
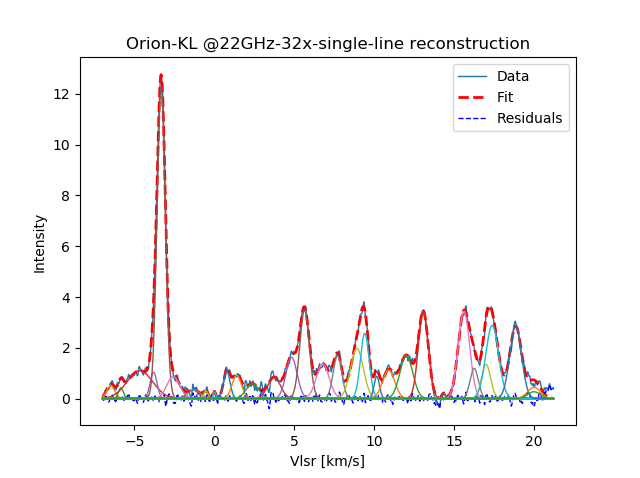
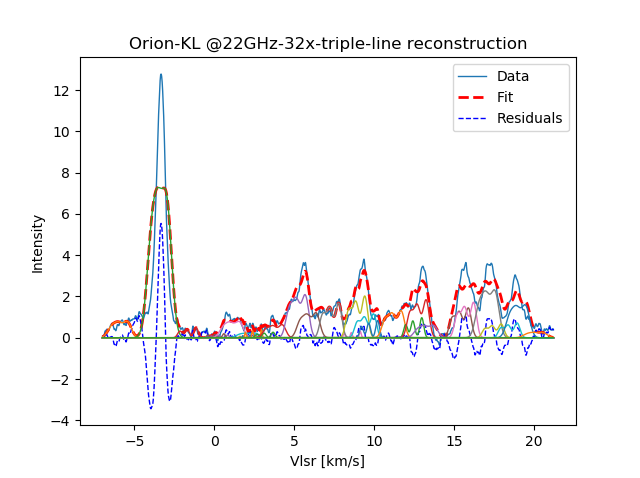
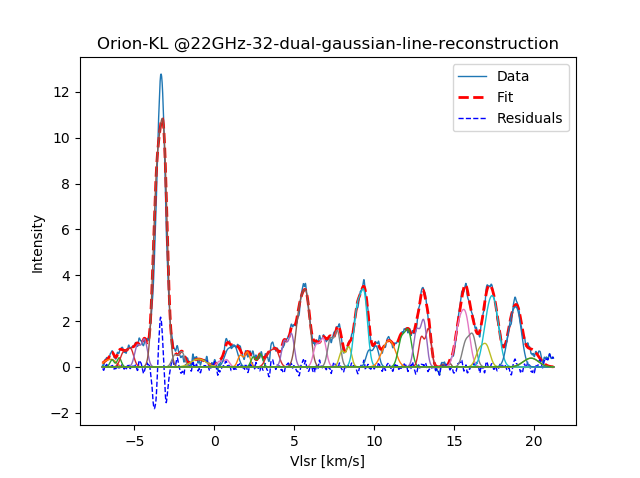
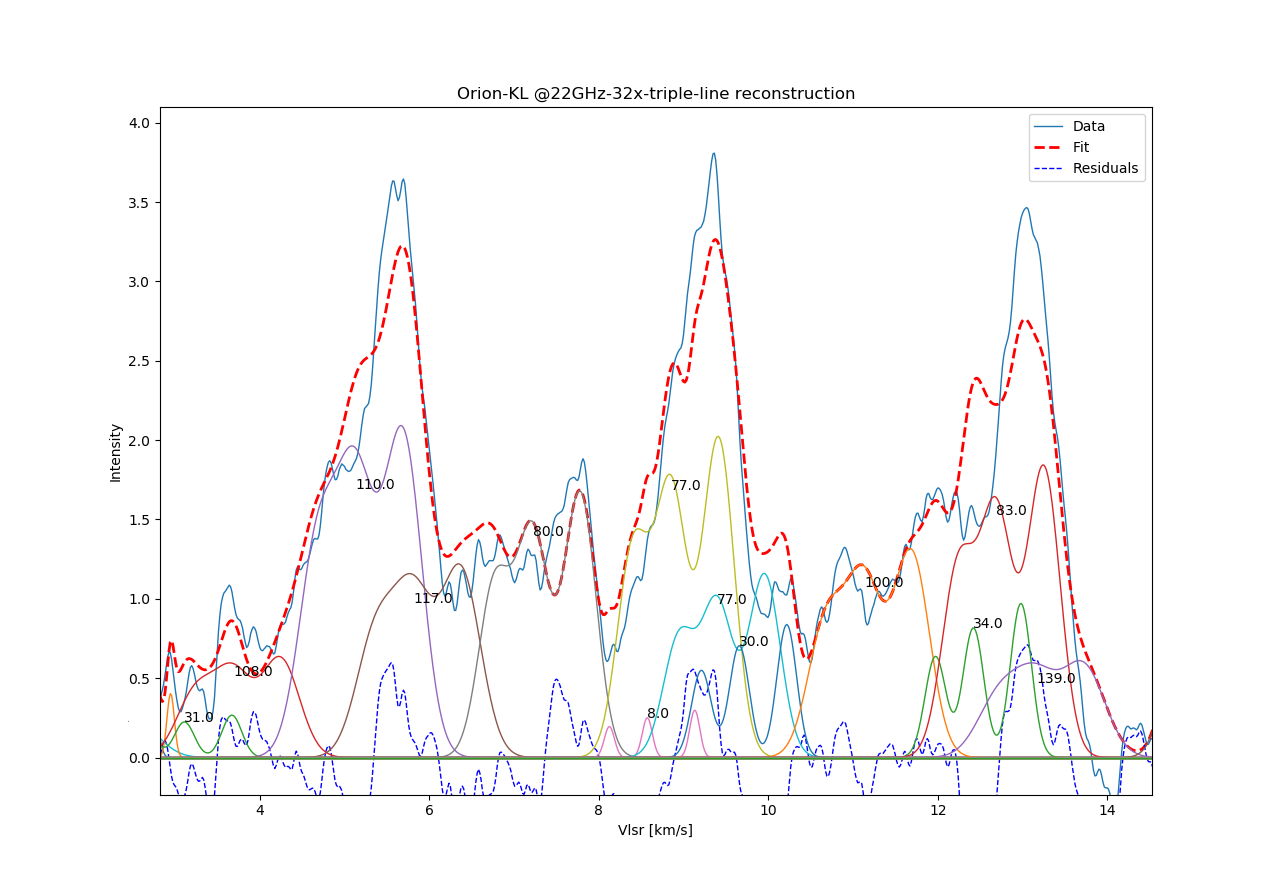
Orion-KL-22GHz-triple-gaussian-3-14kmps-line-reconstruction-temperature
The calculated temperatures for the 3 peaks are about 100 K, wich is also mentioned in the previous papers.
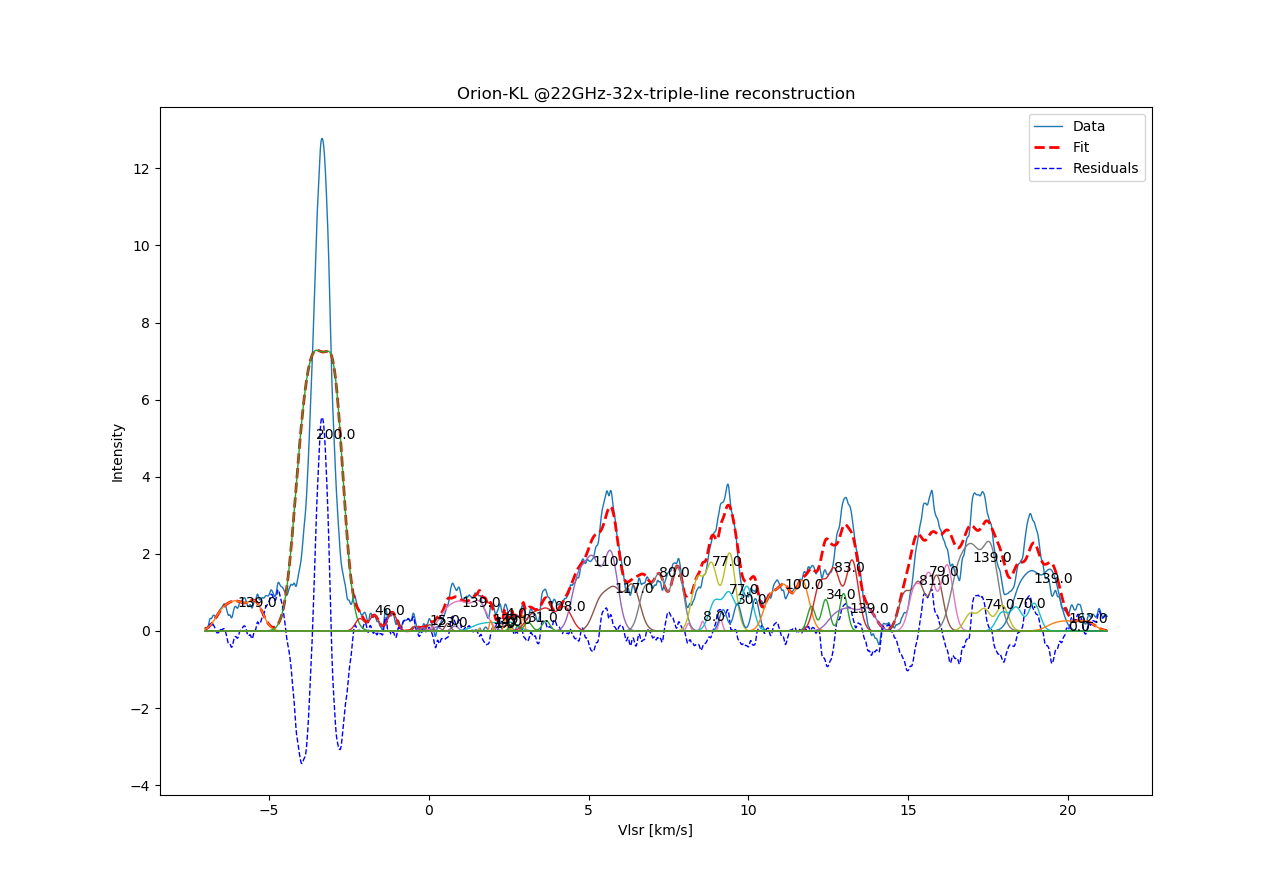
Orion-KL-22GHz-triple-gaussian-line-reconstruction-full
The Vlsr of Orion-Kl is 7.5km/s.
And now the speculative part.
If we take the star as reference to be 0 km/s, then we can calculate the peaks to be at velocities relative to the center proto sun.
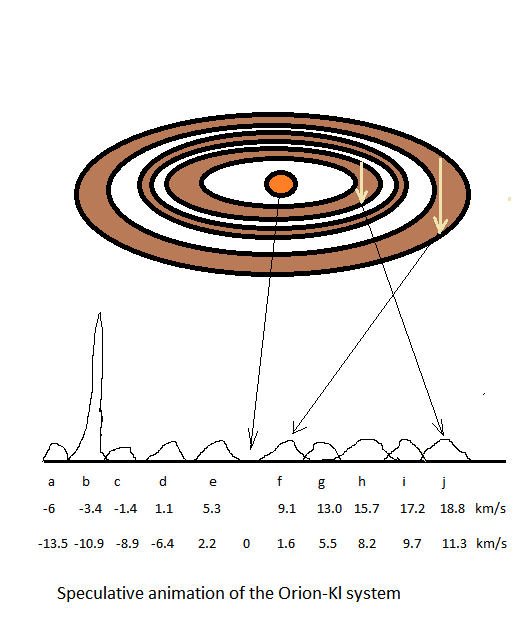
Orion-KL-cartoon
The clouds (e and f) close to the reference are the clouds moving slow around the star, and in a Kepler solar system, these are the most distant rings.
The clouds with the highest velocities (a,b,i,j) circle close to the protostar.
Interesting and logical is also that the temperature of the close by clouds i and j are higher (140K) than the clouds f and e (110K and 80K) far away from the protosun.
As an comparison, the clouds b and j move at about 11km/s and that is in our solar system the speed of Saturn around the sun.
Peak b could be caused by a maser path passing through a warping rim of other rings.
Or it could be a Jupiter like gas orb sweeping up material between the rings, acting as a short for the maser light between the rings.
Michiel Klaassen Januari 2023