

[HOME]
[WEB ALBUMS]
[PROJECTS]
[ARCHIVE]
[DOWNLOADS]
[LINKS]
PROJECTS
Project MK27-W3-IRS5 maser on 22G Hz
We searched almost a week to find W3(H2O), but because we could not find it, The telescope searched in circles around the given location. This was done automatically of course.
We found a spectrum profile, however the peak was located at -37km/s and not on -49km/s.
This means that the source cannot be W3(H2O), it must be W3(IRS5).
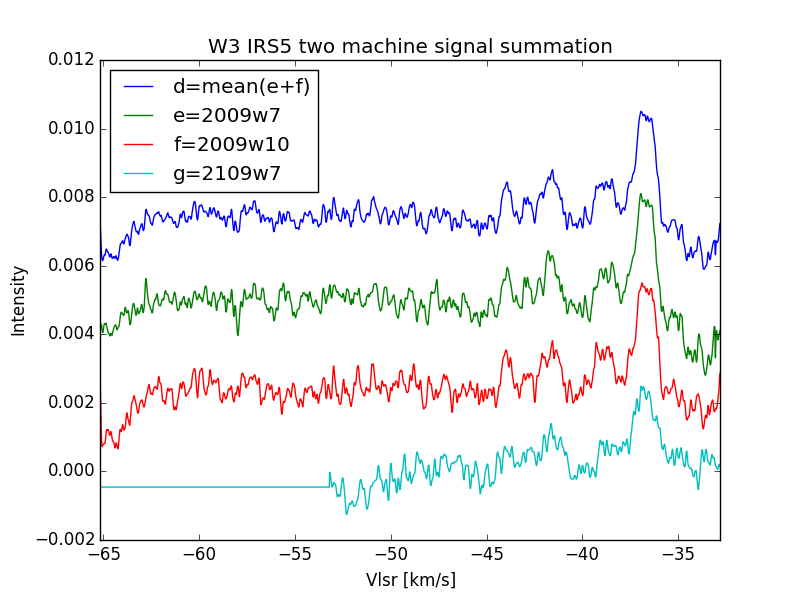
W3-IRS5-multiplot 20/21-09-2022
Interesting is that although the top is almost flat, in the literature sometimes a narrow peak stands on top of the plateau.
When looking at published profiles there can be a lot of single peaks. When too much averaging is done, those peaks will disappear.
We know we do not have a stable LO, so the received energy cannot be certain to be ending up in the correct bin. We will search for a method to enhance peaks on top later.
The difficulties are the same as with other captured sources. If the profiles from different machines and different capturing sessions have to be added, then the two axis have to be synchronized.
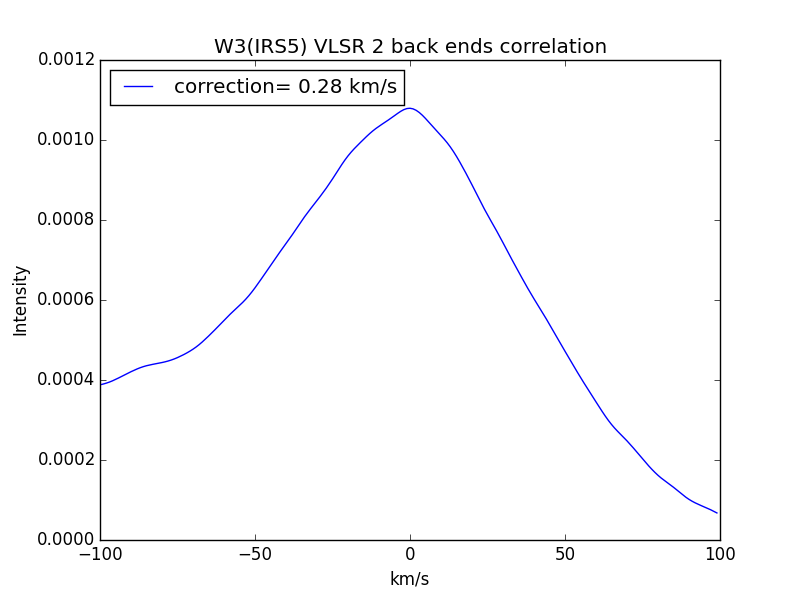
W3-IRS5-x-axis-correlations
The x-axis is mostely frequency or velocity. The frequency can be set correctly but it shifts with time because of the DRO frequency shift. We used correlation to synchronize both. This is done by shifting the x-axis, determine the correlation value of the two graphs, shift again etc.
The highest correlation factor is obtained when both are overlaying each other best.
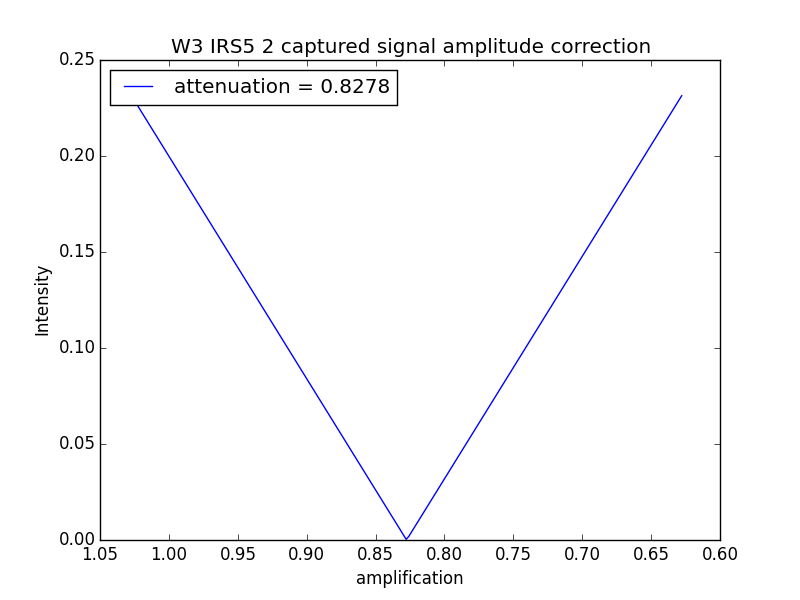
W3-IRS5-y-axis-correlations
Next there is a difference in y-axis; amplitude, because the backend gain train is different.
A correction can be obtained by substracting the profiles from each other and noting the minimal difference while varying the amplification/attenuation.
When all corrections are done we can add the two profiles giving the average of the measurements; plot "d" .
Graph "g" has a low S/N ratio and is just given for illustration.
It took a while to find a professional profile which corresponds exactly our result.
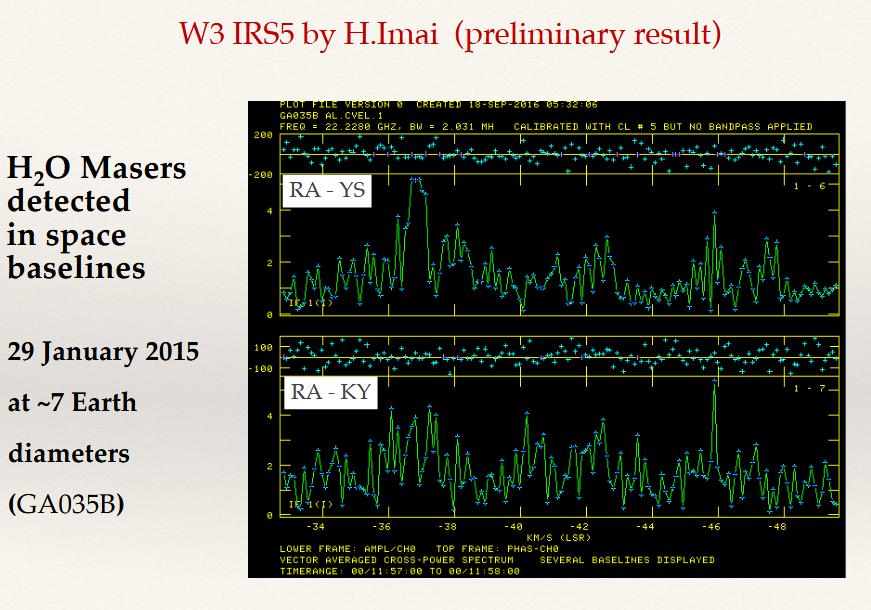
W3-IRS5-by-H.Imai
The velocity or x-axis is reversed, but the profile matches our result exactly.
pdf :Compact structures in cosmic masers: a brief overview of the current RadioAstron results amplification by a rotating foreground cloud.
Info from professional papers show that W3-IRS5 consists of minimum 3 regions of star formation. See the VLBI map figure.
The inset shows a profile masured at Effelsberg 1977.
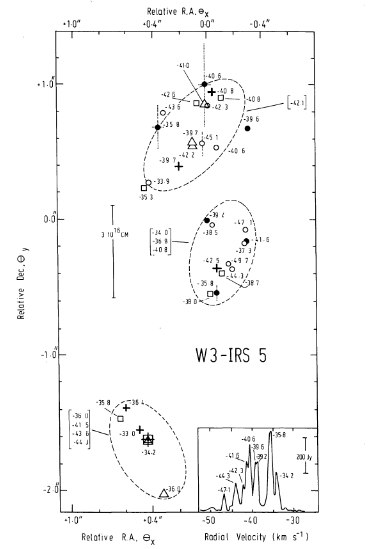
W3-IRS5-3-YSO
pdf :Structure and Kinematics of H2O Sources in Clusters of Newly-formed OB Stars
So the peaks we see in our profile are a mix of 3 YSO cloud movements.
Another scetch was found giving an overview of the region. In the center we see the 3 YSO, but now also outflows are indicated.
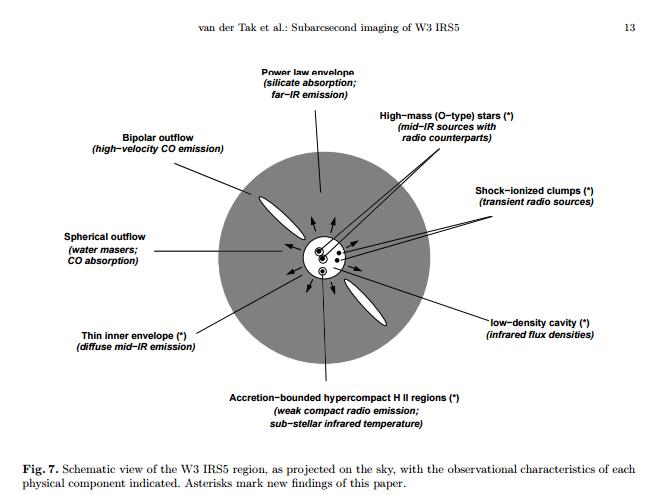
W3-IRS5-schematic-overview
pdf Subarcsecond mid-infrared and radio observations of the
W3 IRS5 protocluster
Michiel Klaassen December 2022