
[HOME]
[WEB ALBUMS]
[PROJECTS]
[ARCHIVE]
[DOWNLOADS]
[LINKS]
PROJECTS
Project MK25: G9.62+0.19 at methanol line CH3OH on 12.178 GHz
Up to now, the Sao Giao Radio Telescope captured masers which were varying slowly over years.
In itself that is an indication that the size of these sources is large.
However there are masers which vary in a short period of time, indicating a small size cause.
Even more interesting is that some of them vary periodically; capturing them with non professional means is even more difficult.
Still we managed to capture G9.62+0.20 with a RTL SDR dongle on 11aug2018 see fig 1.
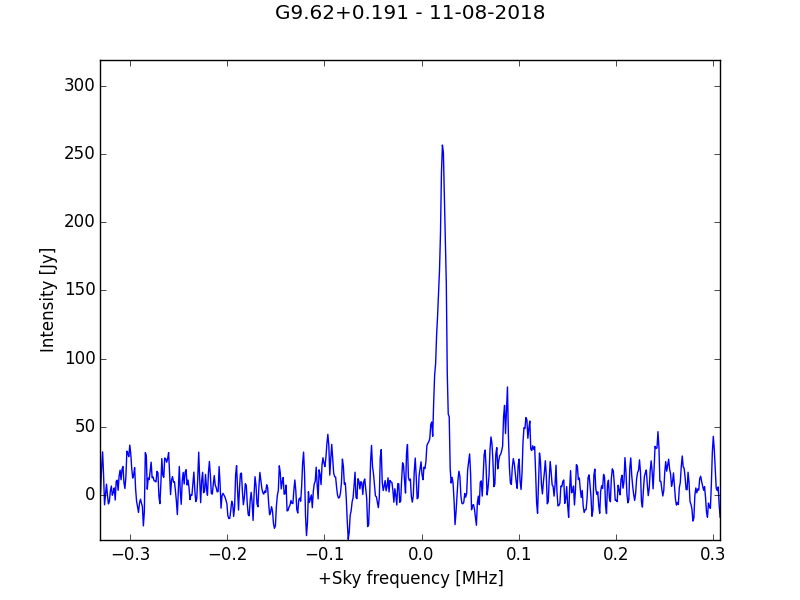
Fig1. G9.62+0.191 with 20 minute integration
It even looks like there are also more peaks left and right of the main feature. Compare this with fig. 2 of the poster or the min/max.jpg.
Remember that the graph is reversed when plotting VLSR in km/s.
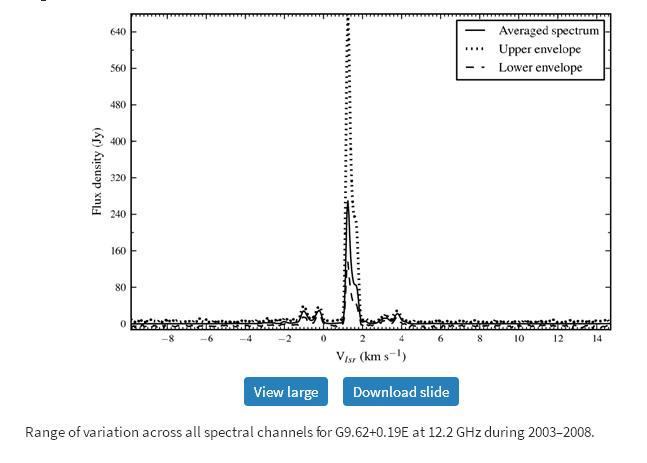
Fig2. G9.62+0.191 minimum maximum
It is estimated to be 250Jy. From the extrapolated values from the poster, you can also deduce 240Jy.
pdf Poster: Tick Tock The 12.2 GHz Methanol Masers in G9.62+0.20. M. J. Gaylard and S. Goedhart
pdf Periodicity in Class II methanol masers in high-mass star-forming regions.S. Goedhart et al.2013
pdf Periodic variability of the mainline hydroxyl masers in G9.62+0.20E. Goedhart et al.2019
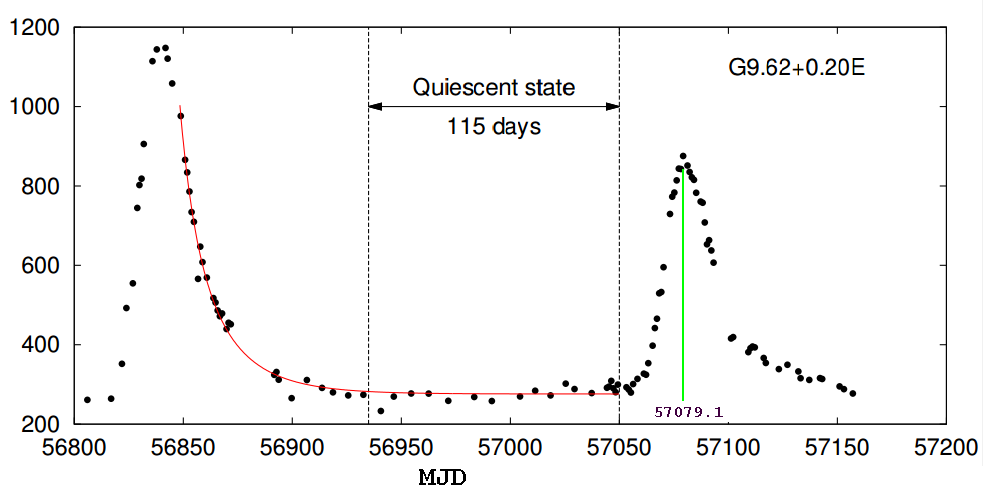
Fig3. G9.62+0.191 curve in time (from ref134)
Also from that poster, ref 129 and ref134 a prediction can be made for the date of the next peak. It can be seen that the peak hight is also variable every cycle.
To be able to capture this maser, the best way is to measure it on the cycle peak moment. The published estimated flare period time ranged from 246d+/-6d (2006) via 243.3d+/-2.1d to 244d (2018).
We used start date 57079.1 2015-02-26, and a period time of 244d.
The next intensity peak dates will be:
0 57079.1 2015-02-26 02:24:00.000
1 57323.1 2015-10-28 02:24:00.000
2 57567.1 2016-06-28 02:24:00.000
3 57811.1 2017-02-27 02:24:00.000
4 58055.1 2017-10-29 02:24:00.000
5 58299.1 2018-06-30 02:24:00.000
6 58543.1 2019-03-01 02:24:00.000
7 58787.1 2019-10-31 02:24:00.000
8 59031.1 2020-07-01 02:24:00.000
9 59275.1 2021-03-02 02:24:00.000
10 59519.1 2021-11-01 02:24:00.000
11 59763.1 2022-07-03 02:24:00.000
12 60007.1 2023-03-04 02:24:00.000
13 60251.1 2023-11-03 02:24:00.000
14 60495.1 2024-07-04 02:24:00.000
As can be seen, we measured the maser on 11 august 2018; 42 days too late to get the top value.
Next; interesting is why is it pulsating.
We know that old stars are pulsating and expelling their shell with freshly produced atoms, but in a protostar fusion has not started yet.
So what is happening here.
One of the observatories measuring these periodic masers is the Hartebeest Radio Observatory (HARTRAO) in South Africa.
Here are several papers with explanations.
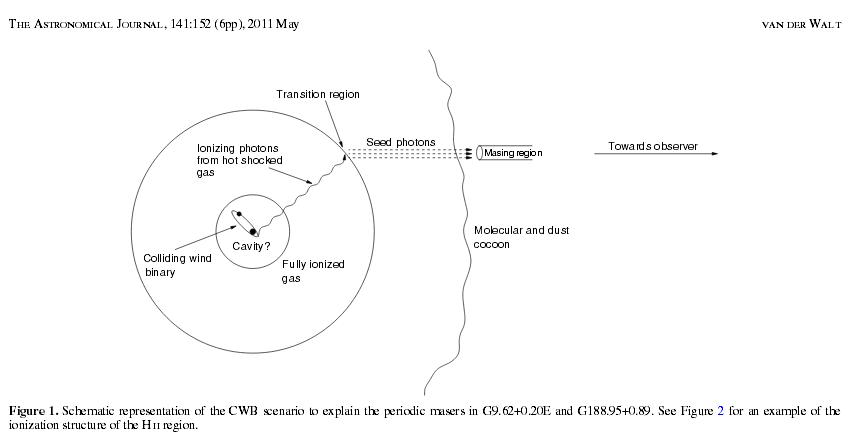
Fig3. Colliding-Wind Binary (CWB) model of van der Walt (2011)
pdf On the methanol masers in G9.62+0.20E and G188.95+0.89. D.J.van der Walt 2011.
pdf Periodic methanol masers in G9.62+0.20E (research note). D.J.van der Walt et al. 2018.
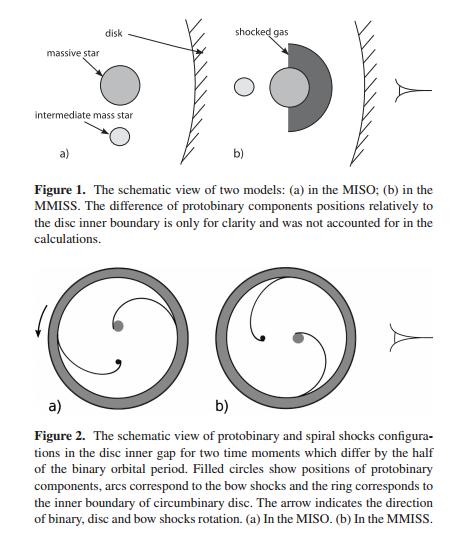
Fig4. Rotating spiral shock model of Parfenov et al. 2014.
pdf On the Class II methanol maser periodic variability due to the rotating spiral shocks in the gaps of discs around young binary stars. Parfenov et al. 2014.