[HOME]
[WEB ALBUMS]
[PROJECTS]
[ARCHIVE]
[DOWNLOADS]
[LINKS]
PROJECTS
Project MK24: Young stellar object Cepheus A at methanol line CH3OH 12.178 GHz
Capturing Methanol (CH3OH) at 12.178GHz form Cepheus A; coord. (ep=J2000 eq=2000) :22 56 17.9 +62 01 49 and galactic coordinate 109.8708 +02.1142, is not easy.
There is only one outstanding peak with a flux of 300jy. The Sao Giao radio telescope has a beamwidth of 0.15 degrees on 12GHz, and so the pointing has to be accurate.
We did several runs, before the first small peak could be seen. Next, the telescope has to be moved up/down and cw/ccw to find the maximum pointing. The correction needed is written in a table and used later to correct next (interpolated) pointings.
Cepheus A is a star forming region (SFR), meaning that no light radiating star is present yet, but a red hot ball is accreding more and more hydrogen from the disk rotating around it, and will continue to do so until fusion in the core starts.
To get the idea how masering works; see a previous post. Most masers are only seen on edge, because only then there is enough material for masing toward us (but there are exceptions)
In reality of course they are huge disks of molecules; spiraling down to the core.
The result, captured with the 9.3m Sao Giao Radio Telescope, gives the peak of the strongest maser spot (300jy).
Here you see the overview. Every line is the integration of 100000 spectra over 5 minutes. The bottom line is the average of the lines between the two blue fat lines.
However it appeared that the peaks shifted over time. There was a drift of the LNB we think. To compensate that, the bins of the lines are shifted back 100Hz/5minutes.
After that the lines are added in the result; the bottom line.
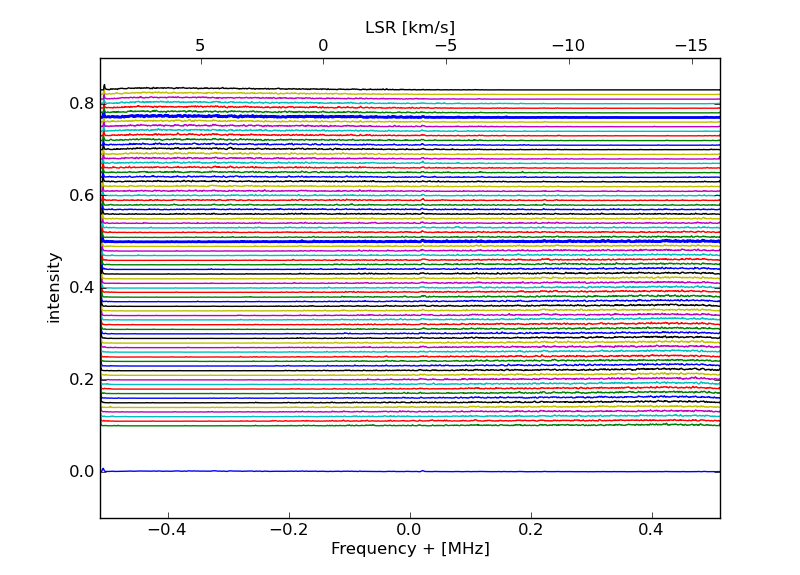
Fig.1 - Every line is 5 minute integration, bottom line is selected sum
Zooming in on th bottom line gives us;
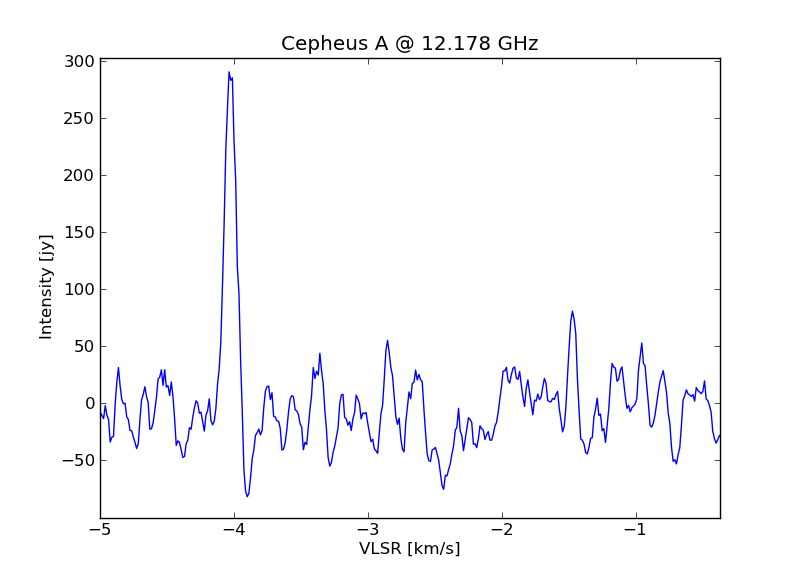
Fig.2 - Final result Cepheus A @12GHz
There is a main peak on -4.1km/s and a small one on -1.5 km/s.
In the reference more peaks/details can be seen in the graph.
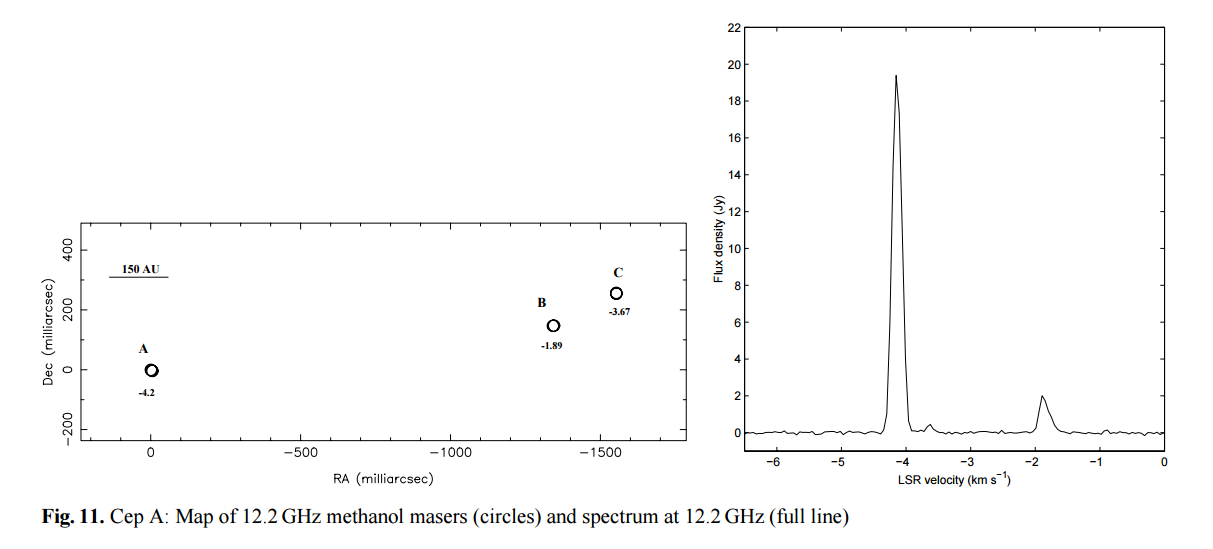
Fig.3 - Cepheus A Reference
The main peaks agree very well, but there is a difference in velocity with the ref peak C -1.7 km/s.
In the ref graph there is another very small peak B, on -3.7 km/s.
In their graph the scale is strange, because in table 1 of that paper, for item A; 30jy, a peak of 300jy is given.
The result in the paper was obtained with a VLBI setup, so the position of the peaks can be determined.
Now you can draw an ellipse through the spots to get the circumstellar ring of the methanol.
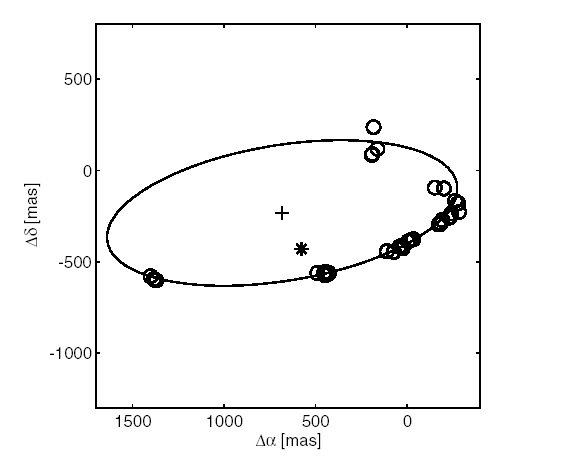
Fig.4 - The ellipse/torus around Cepheus A
Present day location measurements are still better and they now also are discussing a central polar outflow from the system. In these outflows (like HW2) they have found more rotating molecule disks.
In this second pasted picture from a paper you see that the location central star has been shifted; also masers spots have been left out. So also experts are struggling with interpretation of their measurements.
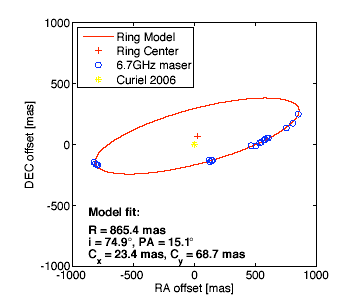
Fig.5 - The ellipse/torus around Cepheus A from a later paper
In general it is interesting to see that observers try to place observed objects into a time sequence, because we cannot wait millions of years to see what happens next.
It is like taking one frame of a motion picture here, and then making another one from a different object etc. Sorting and sequencing all the frames gives a complete movie of an event.
The paper "10th EVN symposium_002" the rotation of the main ring is questioned, and thought to be in-falling matter only. This view could explain the non logical local velocities we measure of the spots situated nicely on the ring.
However for now we stick to the general view that the disk is rotating. Fig 6 gives a sequence of the evolution of the disk and the formation of planets.
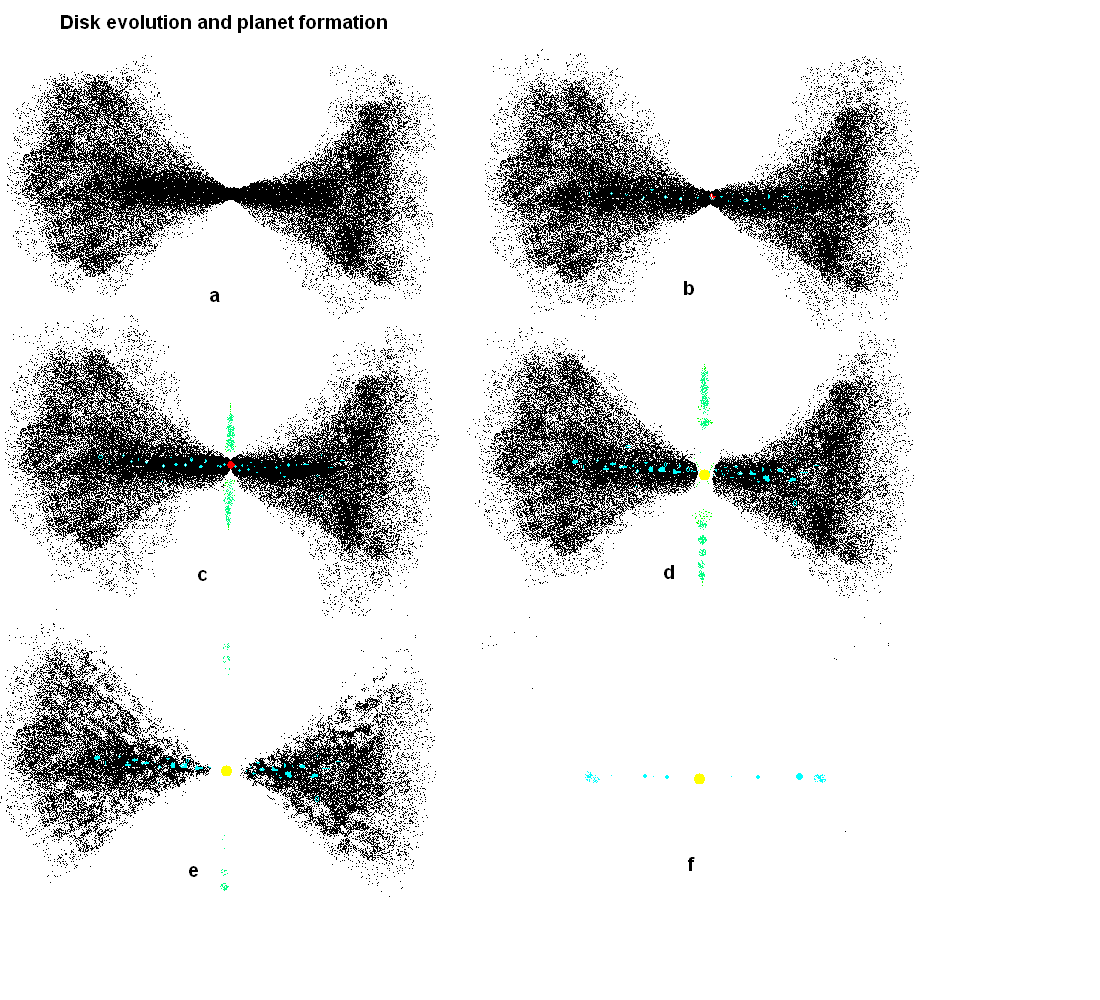
Fig.6 - The evolution of the disk and planet formation
(a) There is no gap between the pre-star and the circumstellar disk yet or it is very narrow.
(b) Accretion continues from the disk onto the proto star when the gravitational pull of the proto star is greater then the star surface (infrared) light pressure.
(c) Large earth or jupiter like chunks can fall into the proto-star.
That solid cold material ( H2,O2, methanol, SiO, H2O) will be turned into expanding heated gas by the hot core in a very short time.
The oxidation reaction CH3OH+O2==>CO2+2H2O and also 2H2+O2==>2H2O takes place and this is in fact the burning of the methanol and hydrogen with oxygen.
Imagine solid methanol, hydrogen and oxygen raining on hot lava.
The steam/gas cannot be blown back into the disk or into the pre-star.
So it can only escape sideways to the poles like two roman candles pointing north and south.
Over time, multiple earth like chunks can fall to thesame fate so the gas jets will intermittently be ejected, until the close by disk rimm is sufficiently dissipated (desintegrated), or the close by disk part is depleted of large chunks.
Small komet/planet like parts will not cause a roman candle like eruption, because a small/slow gas expansion can escape between the proto star and the disk without over pressure.
(d) Eventually the proto-star to disk gap will become larger when UV fotons from the born star desintegrates the dish.
Large chunks who still fall into the new star will not cause jets anymore, but will be evaporated as solar wind, cleaning more of the old disk.
(e) The new star will evaporate all ices upto its Kuiper belt.
(f) Only the planets remain rotating in clear skies, but not growing anymore by accreding material either.
It was not easy to find this object in the first place; the beam is only 0.15 degrees. Because the rail is not perfectly horizontal, the elevation error is dependent on the azimuth.
I noticed that the error is 0.4 degrees over 180 degrees azimuth, so I have to make a correction table and a linear interpolation routine.
So, while measuring I altered the elevation and azimuth a bit to see if the signal was increasing or decreasing.
Every measurement with cfrad2.exe lasts 5 minutes, because 10e5 spectra are summed and averaged. This spectrum can be compared with the previous one and acted upon.
I also have seen a method that the two resulting spectra are subtracted so you get a plus and minus result. When you should be spot on the target and then move the telescope to half beam higher and next 5 minutes to half beam lower, you should get zero result when subtracted.
If not, then your spot on pointing was not correct.
An other peculiarity was that the resulting spectrum was shifting in time. So when you add all the 5 minute results together, then the result is smeared.
An RFI signal in the spectrum however did not shift, so what is the source of the shifting.
When I calculated our VLSR over the observed time it comes out (2Hz/5 minutes) much lower then the observed shift (100Hz/5 minutes).
At this time I do not know for sure(LNB?), but I have corrected it.
Also I have added a paper; on the feasibility of observing masers by amateurs. here in a zip file.
In the zip files I added all the referenced papers here in a zip file.
In another the zip files the original 5 minute integration results were added here in a zip file.
Michiel Klaassen 27 november 2016