
[HOME]
[WEB ALBUMS]
[PROJECTS]
[ARCHIVE]
[DOWNLOADS]
[LINKS]
PROJECTS
Project MK20: Masers; VY Canis Majoris-a
In the list of OH sources http://www.hs.uni-hamburg.de/~st2b102/maserdb/ I found VY CMa to be 300Jy.
However in Portugal it is very low on the south horizon and trees are obscuring this red giant most of the day.
Still when running the test, a result was captured.
Here you find the scan results; every line is a integration period of 5 minutes, and the bottom line is an average of selected lines.
Steering the dish to the source took 25 minutes so no signal was captured, but these line results are used as the reference.
In the 6th result line the source becomes visible. Now the dish starts tracking.
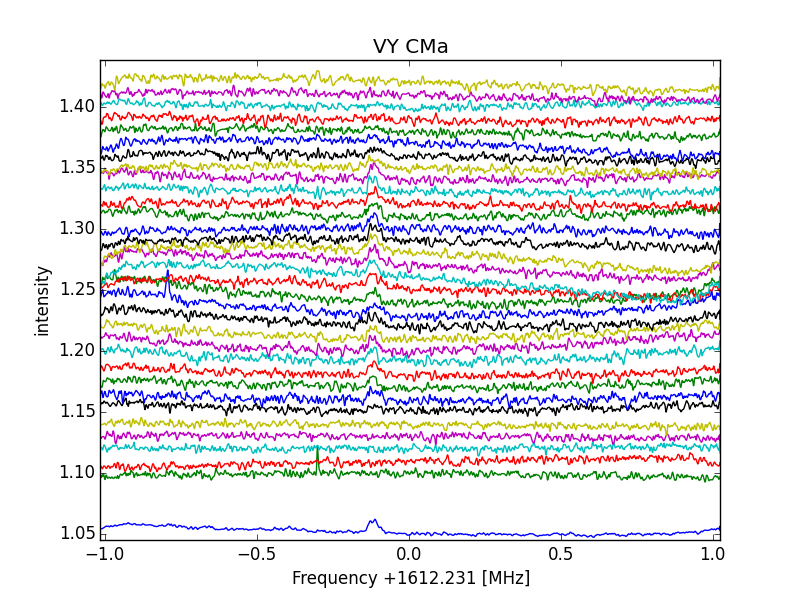
Fig.1 - VY CMa all lines of 5 integration each
Because the dish has a beamwidth of 1.4 deg (proportional to D and lambda), tracking has to be precise.
I use a free python script from http://parac.eu/projectmk8.htm
The next 19 lines show that the source is visible above the trees; The bottom line is the average of these 19 lines.
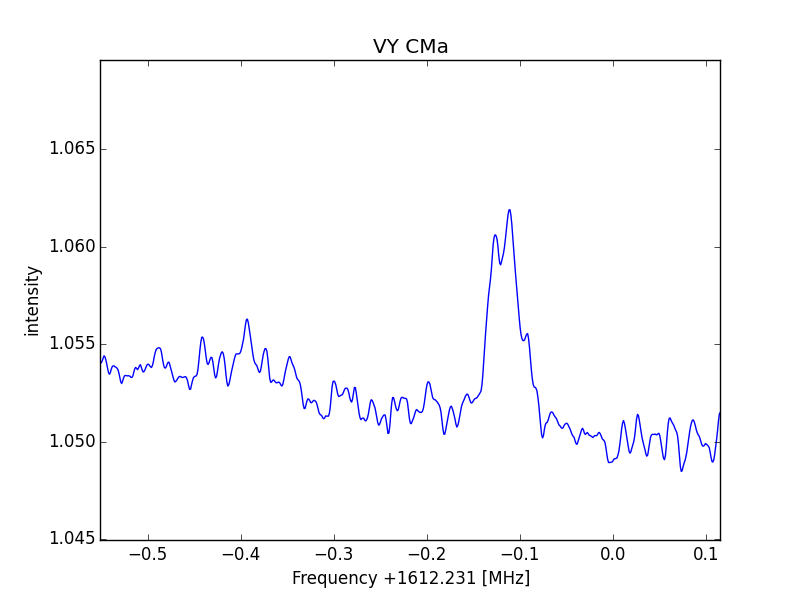
Fig.2 - VY CMa zoomed in
In the then following lines you see the source disappearing behind the trees, so we did not add those to the bottom average.
The main profile resembles the official curve very well;
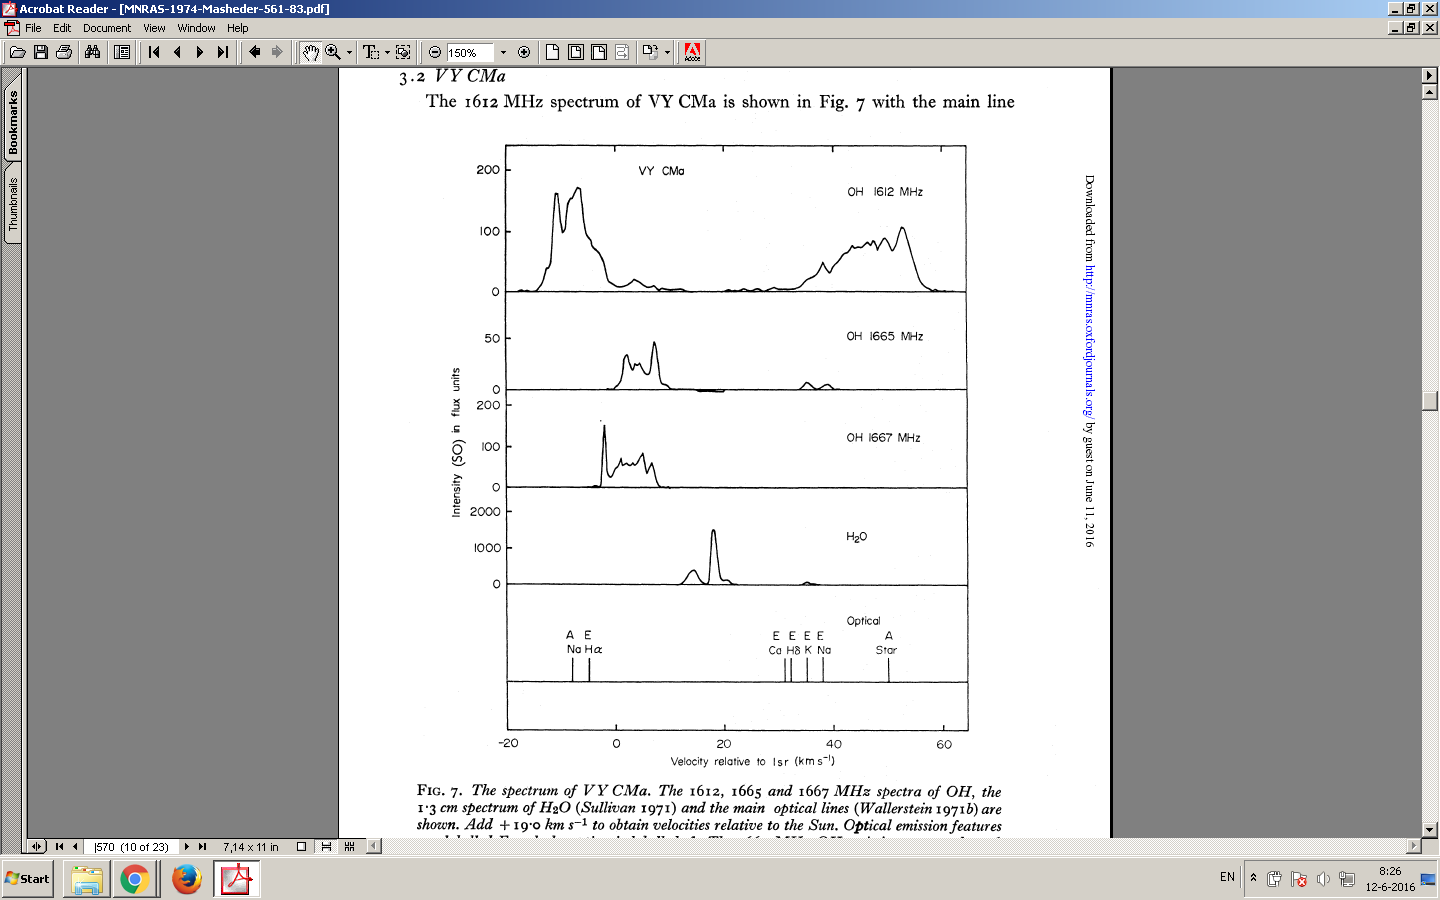
Fig.3 - published profile
The low freq curve is not so obvious; it should have a peak level about thesame to half the high frequency part.
Perhaps this amplitude part is lowering and the high freq part is rising at this moment in time.
I am searching the net, but have not found a recent monitoring result jet.
Another possibility is to calculate the present expected values, when take the high/low freq part values and the known period time.
I have not done that yet.
If you look at the final integrated curve you can see that the low freq peak is at 1611.781MHz and the high freq peak at 1612.131MHz.
The rest freq is 1612.231. Whith the doppler formula you can calculate the differential speed to be 66km/s.
The expansion speed with reference to the centre is 33km/s. This is slightly more than the speed of the expanding NML Cygni giant.
As there are multiple peaks in high and low part, there must be multiple OH envelopes surrounding the star with slightly different expanding velocities.
Starting as a H20 product, this molecule is degraded to OH by space UV as it moves further away from the star. The inner envelopes contain almost sand SiO.
Also this star will become a supernova and a black hole; they calculated within 10E5 year, so keep your fingers crossed to live to tell.
System description
The result was obtained with the Sao Giao Radio Telescope D=9.3m
Antenna feed; chaparral horn designed/tuned for 1612 to 1720MHz
RAS LNA
1x inline amplifier 18dB
RTL dongle, set to 1612.231MHz, sampling rate 2.048MSps, AGC on.
Software; cfrad2.exe, post processing python script.
dish tracking sw; python script
All sw free from www.parac.eu
Added are the result spectra lines in a zip file, so you can use excel or your own postprocessing method to extract the final result also.
here in a zip file.
Michiel Klaassen november 2016