
[HOME]
[WEB ALBUMS]
[PROJECTS]
[ARCHIVE]
[DOWNLOADS]
[LINKS]
PROJECTS
Pulsar post processing tools 3pt-calc.exe, 3pt-plot.py and 3pt.cfg
This software tool can be used to extract pulsar signals from 8bit unsigned IQ data captured with a RTL dongle or equivalent.
First the data has to be captured with the tool rtl_sdr.exe as described in
http://parac.eu/projectmk17.htm
example;
rtl_sdr -s 2e6 -f 419.0e6 -n 2e8 dump.bin, meaning;
-s 2e6; sample rate 2MS/s
-f 419.0e6; frequency 419MHz
-n 2e8; number of samples to process
dump.bin; name of the file
Next the pulsar has to be extracted from that dump.bin and that can be tricky.
From the tools available we have chosen to write our own.
Short description:
3pt.exe chops the IQ file into pulsar periods, performs FFT and writes them as 10 spectrum files to disk.
The python script reads the spectrum files and folds them to one file and plots it in a multi plot graph.
User instructions
-Put the 3pt.exe, the IQ file the 3pt.cnf and the python plot script in one directory.
-Open the config file, edit it, and save it.
-Run 3pt.exe. One processor core of your PC will be occupied completely.
-When finished a number of period spectra files will be written:
--spectrum files containing 10 spectrum rows and 1 sum row each.
--1 band pass file; FYI.
--1 band pass correction file; FYI.
The spectrum files can be examen with a spread sheet program or with the python plot script.
The config file
0.------first part calculation------------
1.pulsar name = B0329+54
2.pulsar period time [s]= 0.71448358541
3.Sample rate [Sps]= 2000000.0
4.search optimal sr(+) or pt(-) [ppm] (default step:+-0.005, 0:off)=0
5.DM= 26.78
6.center freq [MHz]= 404.0
7.IQ input file name =da3.bin
8.number of output bins= 108
9.output file name without extension= abcd
10.process period from= 0
11.process period to (0:all)= 1118
12.clipping and RFI filtering (0:no,1:yes)= 0
13.clipping and RFI filtering level [%]=0
14--------second part folding, plotting----------
15.plot period from = 0
16.plot period to (0:all)= 95
17.fold period from =2
18.fold period to (0:all)=1118
19.exclude channels (0:None else 1..10 csv)=0
20.date, time=12345,5432
21.observatory location=abcde
You can download the 3pt tool here
3pt-version 105
You can download the extended user instructions here
3pt-user instructions 08
Results

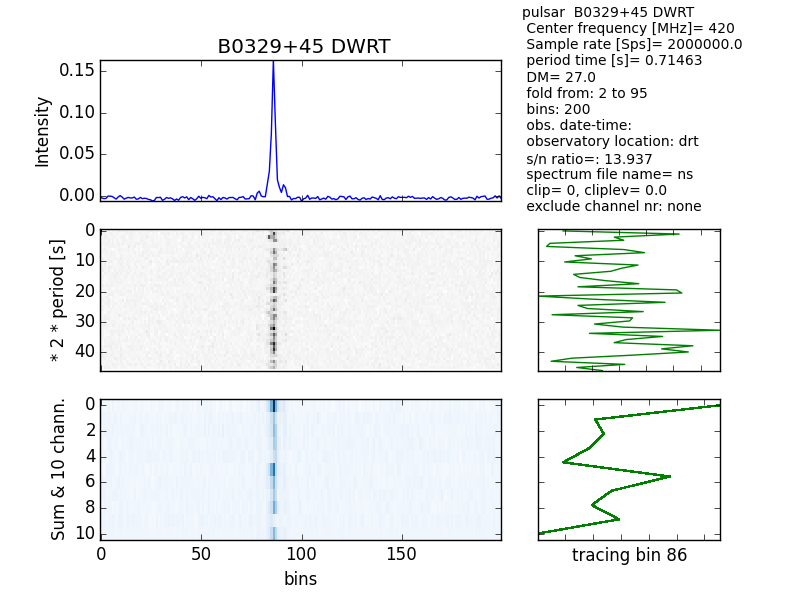
Fig.1 - B0329+45 DWRT

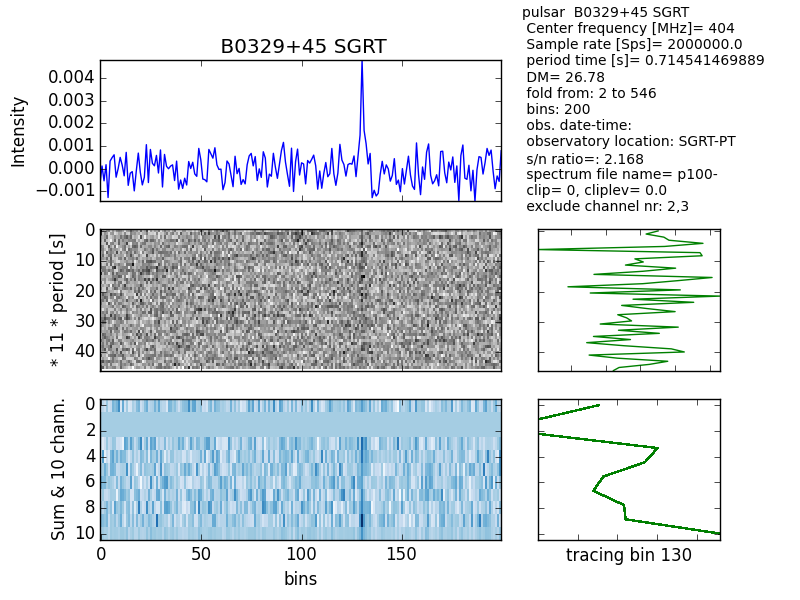
Fig.2 - B0329+45 SGRT

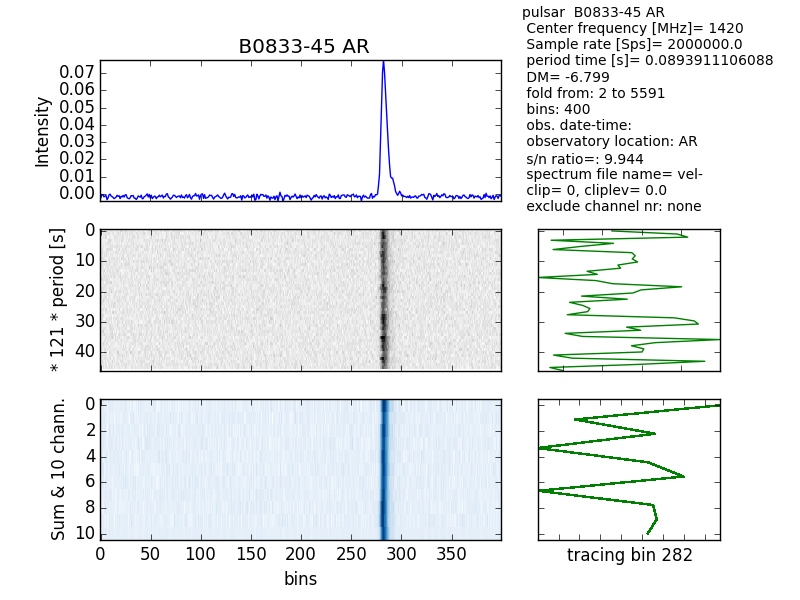
Fig.3 - B0833-45 GGAR

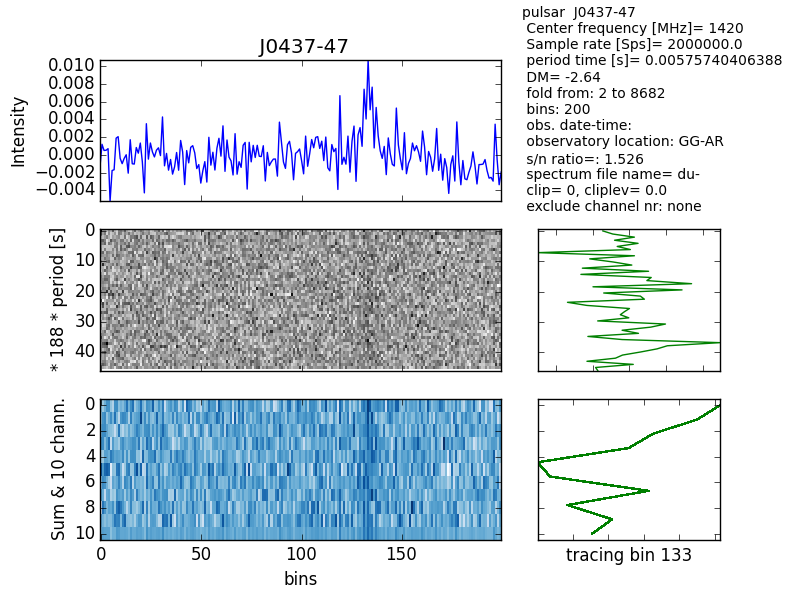
Fig.4 - J0437-47 GGAR
Here are two extra IQ files to work with. These files were captured by Guillermo Gancio, member of the IAR.
see https://en.wikipedia.org/wiki/Argentine_Institute_of_Radio_Astronomy
Two other IQ files (dump2000a.zip and dump100b.zip) can be found here http://parac.eu/downloads.htm
0437-47 IQ data and info
vela1 IQ data and info
Michiel Klaassen july 2020