[HOME]
[WEB ALBUMS]
[PROJECTS]
[ARCHIVE]
[DOWNLOADS]
[LINKS]
PROJECTS
Project MK13: Masers; the OH molecule in the absorption spectrum of Cassiopeia A
Below results fig 1 and fig 2 are OH absorption measurements obtained in the direction of Cassipeia A.
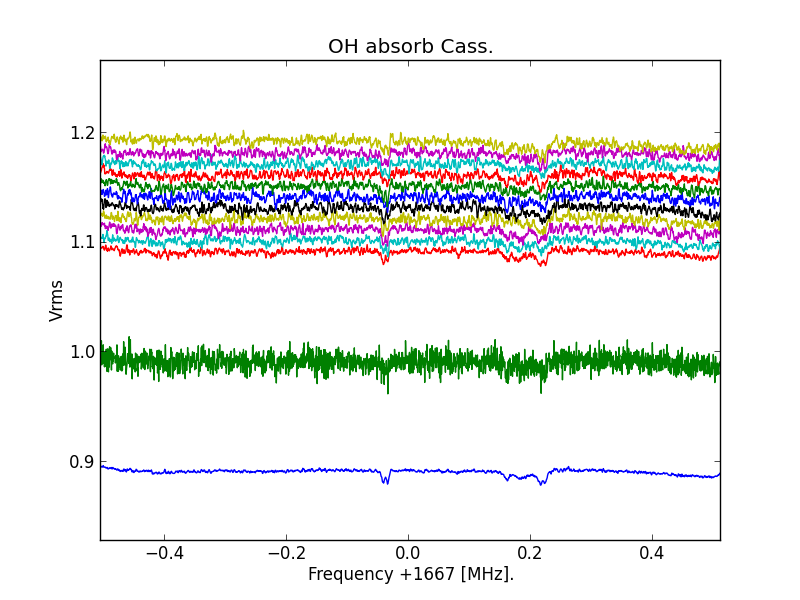
Fig.1 - OH Cas-A absorption overview
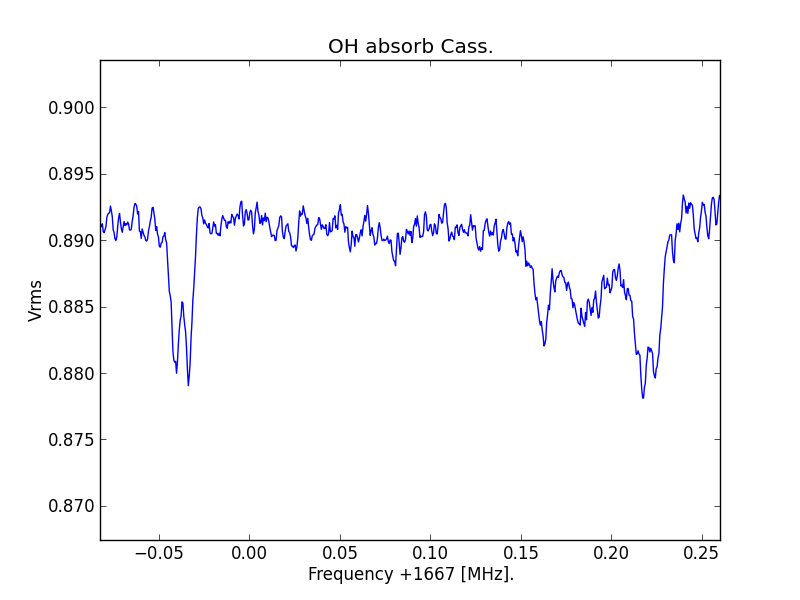
Fig.2 - OH Cas-A absorption sum of lines
Frequency is 1667.358 MHz and via the Stockert downconverter it could be measured with my RTL dongle.
There was a small problem; I forgot to do a reference measurement. So for fig 1 I took the run of the reference of the trial to detect OH in the Love Joy comet.
Also we forgot to note the exact sky frequency. Anyway I decided to show the results as is.
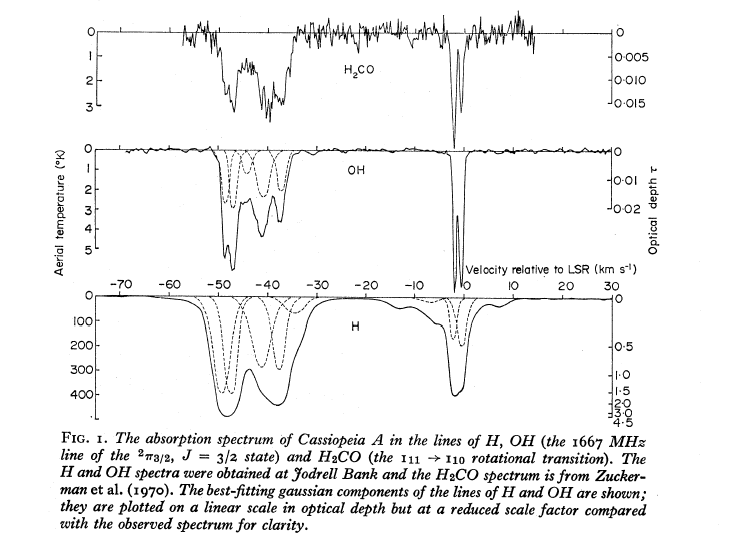
Fig.3 - OH Cas-A absorption reference Davies Matthews
In the paper of Davies and Matthews here I found a similar curve see fig 3.
Also I added the result the Astropeiler group made completely with their fpga backend; fig 4.
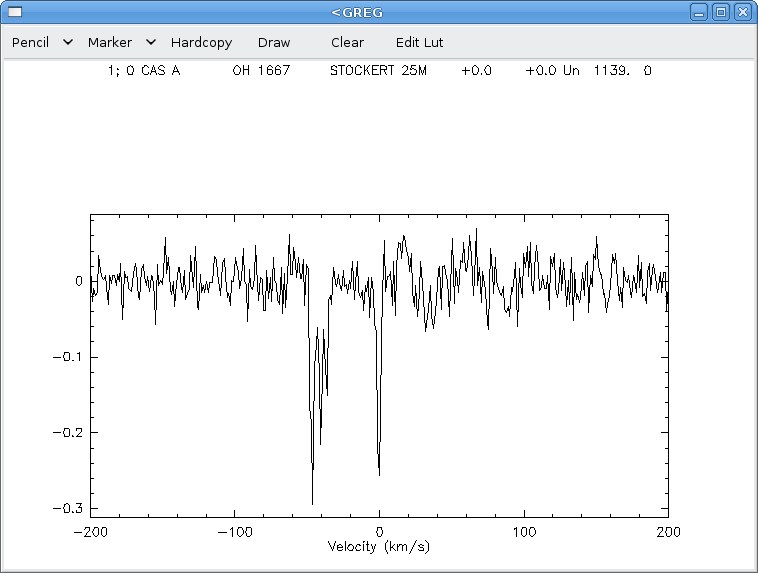
Fig.4 - OH Cas-A absorption reference 1
You can see that the horizontal scale is reversed; km/s; the official notation.
As with my other measurements you can see that there are two peaks again; however this has nothing to do with gas rotating or pulsating around a star.
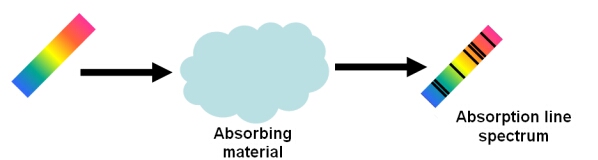
Fig.5 - Line absorption principle
Like with every absorption measurement this also was obtained because a radio source: in this case Cassiopeia, radiated a broad spectrum of radiowaves as a backlight source.
Next the waves arrive at molucules which absorp a foton of a certain energy and retransmit that foton again fig 5.
However the new foton will not travel in thesame direction it came from, but radiates in a random direction. Result is that we receive less retransmitted fotons than from frequencies not absorbed. Thats why we see a dip in the spectrum.
If there are sufficient molecules; like a cloud, in the line of sight, then we see a dip.
The varying sky frequency comes from the movement of the clouds; yes, we see the arms of our galaxy again. The difference in velocity of the arms toward us is about 45 km/s.
The nice thing to see is that on other maser frequencies, so other molucules, we see thesame curve. So the arms contain thesame stuff even though the distance between the Orion and Perseus arms is huge.
If you look at the width of the curves ( is movement of the molucules = temperature), you can see that one molecule is heavier than the other (narrow width).
The depth x width of the dips gives the ratio of the amount of different molecules.
With the discovey of the OH absorption line the maser story started; here you will find the note of Weinreb and colleques 1963.
In this note it is said that for the first time digital tecniques were used to calculate the spectrum. Today we all use a $20 dongle to get thesame result.
Also in his note you see that Weinreb only discovered one dip because he measured with a small bandwidth.
He used 30minutes integration time. With cfrad2.exe we used 10x5x0.6= also 30minutes. The Millstone Hill dish was about thesame size 30m; and Stockert 25m.
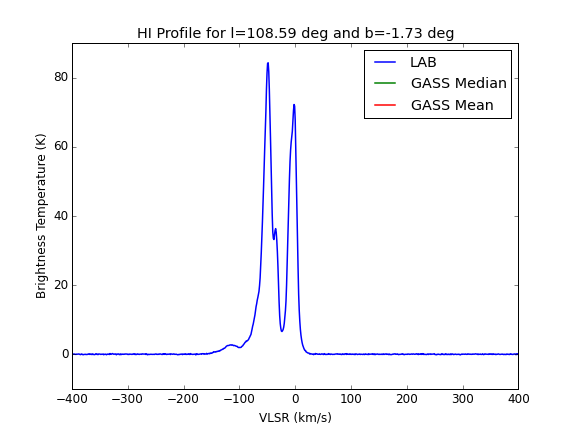
Fig.6 - H1 profile in Cas-A direction
As a further comparation here is also the graph of the neutral hydrogen line in the same direction; obtained from https://www.astro.uni-bonn.de/hisurvey/profile/index.php
Again you can see the two peaks, which belong to the two arms.
I like to thank Wolfgang Hermann and his team to give me the opportunity to measure these and previous results.
Michiel Klaassen; february 2015