
[HOME]
[WEB ALBUMS]
[PROJECTS]
[ARCHIVE]
[DOWNLOADS]
[LINKS]
PROJECTS
Project HS01: The accuracy of the HS 3m radio telescope for H1 observations.
For some time I wondered what the accuracy of my H1-gas speed measurements was.
To get an answer, I tested my measuring setup on some essential points. The results are bundled in this report. The following items will be presented.
1. Speed of the observer.
2. Systematic error in the dongel frequency.
3. Temperature influence on the dongel frequency.
4. Temperature influence on the LNA gain.
5. Temperature influence on the dongel gain.
6. Verification of the telescope pointing.
7. Checksum using a telescope observation.
8. Summary of the main corrections and conclusion.
9. Supplement: picture of the dongle enclosure.
1. Speed of the observer.
The speed difference Vrel, between the observer and the H1-gas can be calculated from:
the observed frequency = fpeak,
the speed of light =Vlight and
the rest frequency of H1-gas = 1420.406 MHz.
The relationship between them is:
Vrel = ((1420.406- fpeak) * Vlight )/1,420,406 Hz and m/sec (1)
The speed Vrel is presented to the observer as a Doppler shift on the rest frequency of the H1-gas and is expressed as: ? f Doppler . The shift is composed of two parts:
Vrel = Vlsr + Vabs m/sec (2)
Part I. Vlsr depends on the speed of the observer.
This speed varies in time since the stars in the galaxy disk do not actually move on perfectly circular orbits, and this is also the case for the observer.
Part II. Vabs depends on the location of the H1-gas.
When a constant path velocity in the Galaxy is supposed, the perception of Vabs is only influenced by the angle of view with the moving H1-gas.
Both parts have a common point of reference i.e. 'the Local Standard of Rest’. This virtual reference point is located at the solar neighborhoods which moves at a circular orbit around the galaxy center at constant speed. Equation (1) can be reduced:
Substitute (1420,406- fpeak) in Delta f Doppler and add all constants together to obtain:
Vrel = 0.211 * Delta f Doppler kHz and km/sec (3)
Combining equation (2) and (3) gives:
Vabs = 0.211 * Delta f Doppler -Vlsr. kHz and km/sec (4)
The internet page, Ed Murphy's Vlsr calculator, which I used in the past for the Vlsr calculation is temporarily (sic) not available. An alternative was found in a routine of the Dwingeloo telescope. The routine is edited to a standalone program in Linux for a Raspberry Pi computer. Its output is red by a web interface, with a Windows computer that runs the other software of my telescope.
Calculation with the program VLSR
Vlsr calculation parameters on the galactic anticenter:
Galactically coordinates: l = 180 and b=0.
Observing location: Schoorl on 26 November 2015.
Input:
RA (radians): 1.51
Decl (radians): 0.51
Equinox (year): 2000
LAT (radians, east = +): 0082
Long (radians, north = +): 0.9198
Elev (m): 6
Rest frequency (MHz) 1420.405752
Results:
This gives several results. Most are not relevant here and are therefore omitted. There are two results produced for the Vlsr. The values of Milhalas and Binney are said to be the most accurate (private communication) and are therefore used in this report.
Doppler Frequency F=1420.3546166 MHz (for information)
VLSR: IAU V1 = -1.956372 km/sec (for information)
VLSR: Mihalas and Binney V1 = -3.212949 km/sec
2. Systematic error in the dongel frequency.
The dongle oscillator (dongle type RTL R820T) is not calibrated when purchased. With an external frequency generator (HP 8648 B), the frequency can be adjusted by software. The actual numerical example below indicates the impact of this error.
The correction at 20 C is expressed in ppm of the H1-rest frequency: 1 ppm = 1.420 kHz. A deviation of 53 ppm give rise to a difference of 75.28 kHz. This value in eq. (3) represents an error of 75.28 = 0.211 * 15.9 km/sec .
3. Temperature influence on the dongel frequency.
The measurement value delta f = zero of the graph below has the parameters:
input frequency 1420, 405752 MHz
the readout is brought to the same value at 20 C with a correction of 53 ppm.
By varying the temperature the output frequency is shifted. The maximum abnormalities are plus and minus 1 kHz at a total temperature fluctuation of 50 C.
The registration program CFRAD (www.parac.eu) performs a Fourier operation on the dongle-signal. A frequency range of 2000 kHz is hereby analyzed across 2048 test points.
One measuring point corresponds to 0.976 kHz. The presented deviation in CFRAD results then at 2 measuring points.
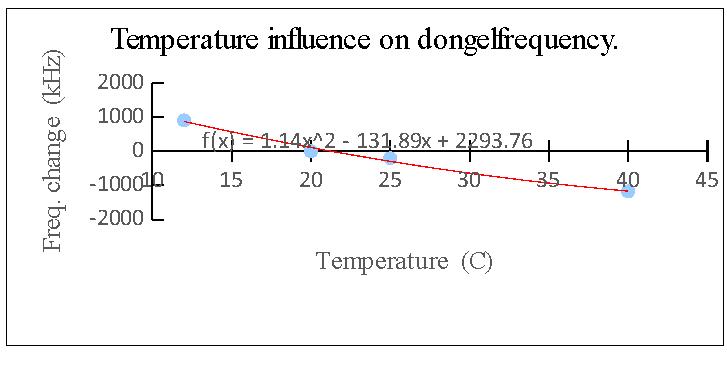
Fig.1 - Temperature influence on the dongle frequency
4. Temperature influence on the LNA-gain.
Using the LNA type VLNA21 of G4DDK its temperature will rise. Depending on the outside air temperature it amounts ca 10 degrees C. With a thermocouple and a signal source I have set out the relationship between the temperature and the output of the LNA. The measurements show that there is no impact on the performance of the LNA.
5. Temperature influence on the dongel-gain.
The dongle is getting hot while it is in use. With a thermocouple and an input signal of 1420.406 MHz I have laid down the relationship between the temperature and the output of the dongle. The previous figure shows that the output of the dongel is substantially influenced by temperature fluctuations.
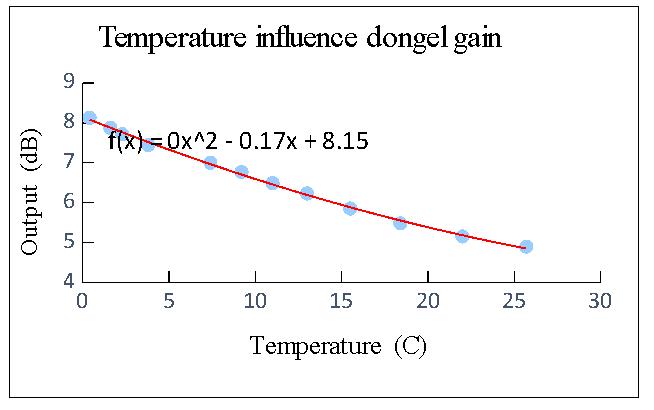
Fig.2 - Temperature influence on the dongle gain
6. Verification of the telescope pointing.
The telescope pointing is regularly checked by comparing it with the sun position. The deviation varies some tenth of a degree around a fixed value. The fixed value is set upon the telescope setting. With a beam angle of 5 degrees the variation from the fixed value can be ignored.
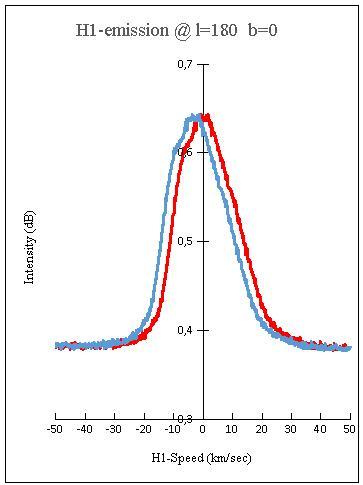
Fig.3 - Verification of the pointing
7. Verification with a telescope observation.
(Only the position along the x-axis is regarded)
At the Galaxy coordinates:
l = 180 and b = 0, the line of sight is perpendicular to moving H1-gas. In this setup, there is no Doppler shift. The peak frequency fpeak is expected at 1420.406 MHz. Earlier is calculated that Vlsr = -3.2 km/sec. This value is negative and means that:
the distance between the observer and the LSR decreases and
the observed frequency increases.
A test measurement.
A measurement shows that:
fpeak = ca. 1420.420 MHz.
This corresponds to a Vlsr of:
(1420.406-1420.420)*0.211= -3.0 km/sec.
The error amounts -0.2/3.2= -6 %
8. Summary of the main corrections and conclusion.
Three points deserve special attention:
1.Speed of the observer: correction for Vlsr
2.Temperature sensitivity dongle: maintain its temperature at a constant value.
3.Error of the dongle frequency: calibration with a frequency generator.
The Doppler shift of the H1-gas can be measured, with a relative good accuracy. With “relative” I refer to the simplicity of my telescope and unfavorable location.
9. Supplement.
Picture of the dongel housing with a Peltier cooling device on top. A regulator keeps the temperature constant at:
20 C tolerance : + or - 0.5 C
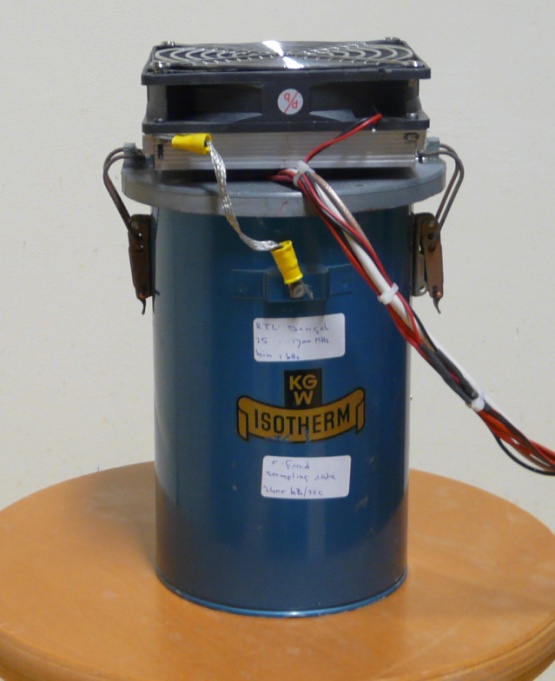
Fig.4 - Temperature stable dongle housing
This page can also be downloaded as a pdf file; here .
Hans Smit December 2015.